Bitcoin was launched in 2009 by a pseudonymous inventor Satoshi Nakamoto. It is the first decentralized cryptocurrency to successfully record transactions on a secure blockchain based network.
During the initial stages there was no price for Bitcoin since no one was actually buying it and there were no exchanges like we have today. Users were mainly fans of cryptography who were transferring Bitcoin as a hobby for very little to no value.
The first time Bitcoin actually acquired some value was on 12th of October 2009 where a Finnish developer Martti Malmi sold 5050 Bitcoin’s for $5.02.
Found the first known bitcoin to USD transaction from my email backups. I sold 5,050 BTC for $5,02 on 2009-10-12. https://t.co/8XcBmzJljf
— Martti Malmi (@marttimalmi) January 15, 2014
This gave Bitcoin a value of $0.0009 per BTC.
Another user named “SmokeTooMuch” on Bitcointalk forum auctioned 10000 BTC for $50, but no buyer was found.
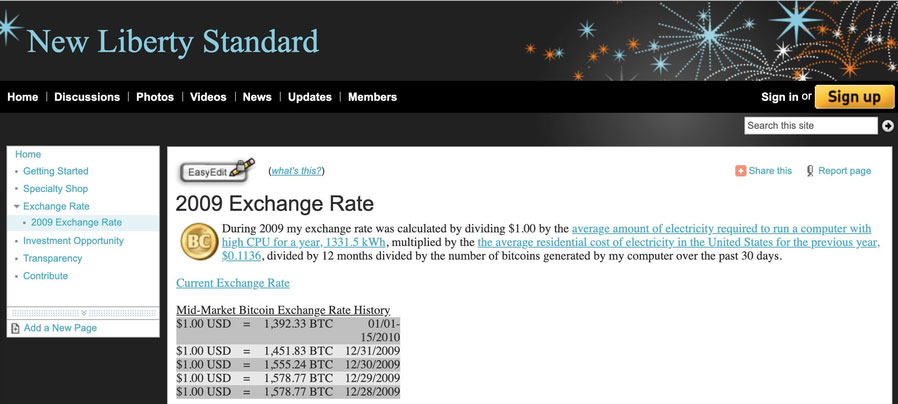
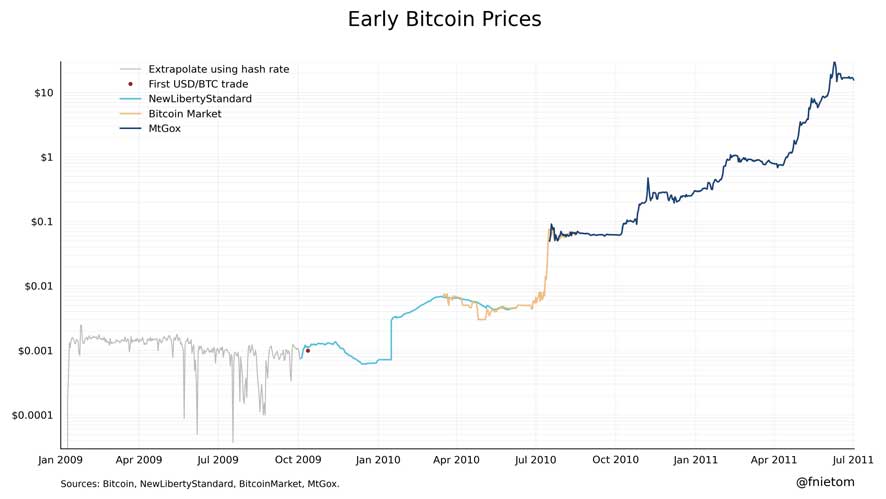
Then came first exchange “New Liberty Standard” which was based on cost formula that derived the price of Bitcoin from its hash rate. Then exchanges like Bitcoin market and MtGox came into the scene.
Slowly Bitcoin gained traction and from less than $0.01 USD it skyrocketed to $1 in a year.
It’s been more than a decade and Today Bitcoin is being traded 24×7 on 100s of exchanges worldwide and is priced at around $18000 U.S dollars. It was and it is the largest cryptocurrency by market cap.
It is close to breach the previous ATH (all time high) of $20000 which was recorded on December 2017.
Will it set a new all time high this time and where is it going from here? No one knows for sure. But by looking at the Bitcoin yearly candles and the previous halving cycles it looks like Bitcoin is ready to print a huge green candle by 2021.
Bitcoin yearly chart – Halving chart
You know halving is an event that is programmed into Bitcoin’s code. It occurs every four years where the block rewards gets cut in half.
The first halving occurred in 2012 where the mining block reward was reduced from 50 BTC to 25 BTC. In 2016 another halving event took place which cut down the rewards from 25 BTC to 12.5 BTC. Again in 2020 the supply was cut in half. Now the block reward is 6.25 coins per block. It will reduce to 3.125 coins by 2024 making it even more scarcer.
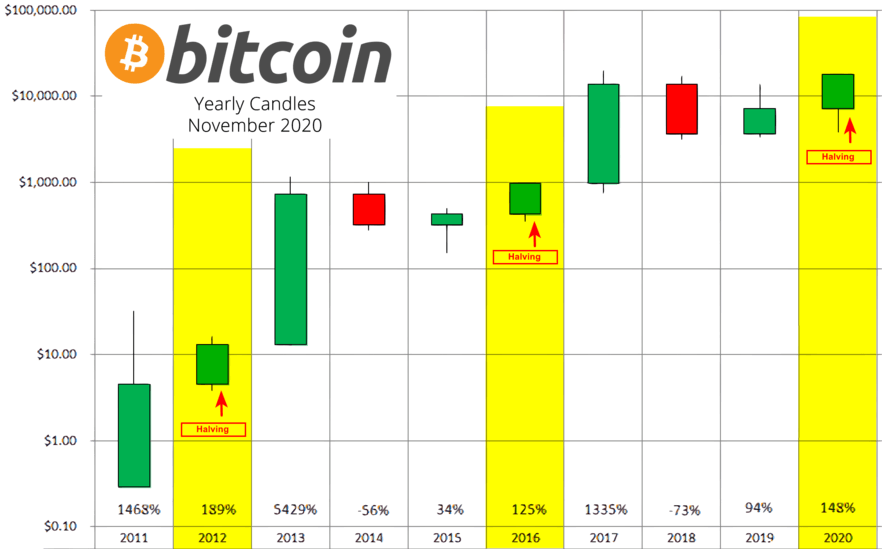
While the halving event occurred on different times every 4 years what seems evident is that Bitcoin tends to do very well following the halving year. As you can see there seem to be an pattern emerging on the yearly chart. With three years of upside followed by a year of decline. Especially the last candle is much larger than the prior two candles. This oversized green yearly candles could very well be the result of halving.
With that said Bitcoin is still a young asset and its only been around for a decade. Just from observing two 4 year cycles we can’t come to an conclusion. However if this pattern holds true and if history repeats itself then Bitcoin will see a tremendous growth in 2021.
How to view Bitcoin Yearly candlestick charts?
Whether you are a trader or an investor it is very essential to know how to read price charts. Charts provide insights on the movements of an asset and it helps you decide when to buy or sell. To know how the price of Bitcoin has moved over time just look at the price chart. Especially Bitcoin candlesticks gives a complex view of the price movements in the given time period.
[cryptocurrency_widget type=”chart” template=”multi-period” color=”blue” assets=”BTC~USD” period=”max” axes=”true” cursor=”true” api=”cryptocompare.com” realtime=”false”]Bitcoin candlestick charts can be viewed across multiple time-frames such as 1minute, 3m, 15m, 30m, 1 Hour, 2H, 4H, 12H, 1 Day, 3D, Weekly and Monthly. However most crypto chart analysts and traders pay more attention to longer time-frames. Especially the daily, weekly and monthly price charts. It gives a better grasp on the market and the trend that the asset is undergoing.
While the yearly charts gives a bigger overall picture not many uses it often as compared to other longer time-frames. Also on Bitcoin exchanges you can only find charts with hourly, daily, weekly and the longest being 1 Month. Not many does yearly candlestick chart. Even on Trading view and other charting sites there is no option to view Bitcoin chart in yearly time-frame. Unfortunately you’ll have to draw yearly chart for Bitcoin manually.
One particular analyst on Twitter (@ChartsBtc) shares yearly charts in logarithmic (log) scale. Other than that they are also sharing price history (log scale), halving candles, chart for Bitcoin hashrate overtime, market-cap chart and few other interesting charts. Do check them out.
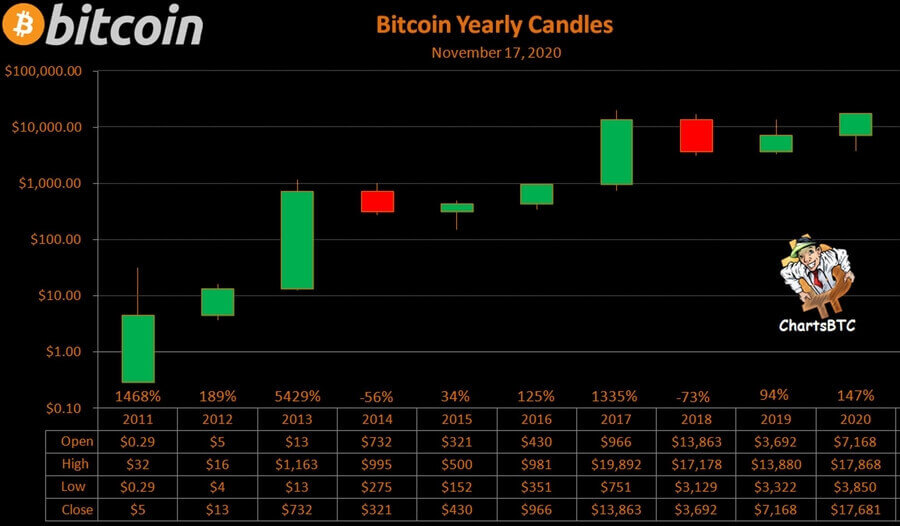
The Bitcoin yearly candle is going to close pretty soon and this is how it looks. It is up 150% YTD (Year to Date).
Do you think a big fat green candle is coming next year resulting in huge parabolic run up in Bitcoin prices like we saw in 2013 and 2017? Do let us know your thoughts in the comments.
Risk Disclosure:
Trading Bitcoin is risky and is not suitable for everyone. If you are not sure what you are doing then stay away from trading. On the other hand investing in a cryptocurrency is a decision that depends mainly on your personal risk tolerance. Only invest what you can afford to lose.
When you look at the yearly candlestick chart it can be hard to not be bullish. But don’t chase and buy the very top. Buy the dips and dollar cost average.
Note: This article is only for educational purposes and is not is not meant to be a trade or investment advice. Understand the risks and please do your own research before making any financial decisions.