How often have you heard this term “CME gap” on Twitter, Reddit and other social media platforms. People usually refer to CME gaps during and after the weekends. “There is a CME gap at $62000”, “Bitcoin is about to make a huge gap on the CME chart”, “gap has been filled” and so on. Traders mind the gaps often.
So what does CME stands for and what is a CME futures gap? Why it matters to Bitcoin and how do you spot gaps on the Bitcoin chart? Also how are gaps formed in first place and how often do these CME gaps get filled? Here we’ll explain everything in detail.
Before we analyze what Bitcoin price gaps are let’s first see what CME is?
What CME stands for?
CME Group Inc – CME stands for Chicago Mercantile Exchange. It is the world’s largest financial derivatives exchange. This futures platform allows one to trade variety of asset classes like: agricultural products, energy, stock indices, fiat currencies, interest rates, real estates, metals and even they have futures trading options for weather.
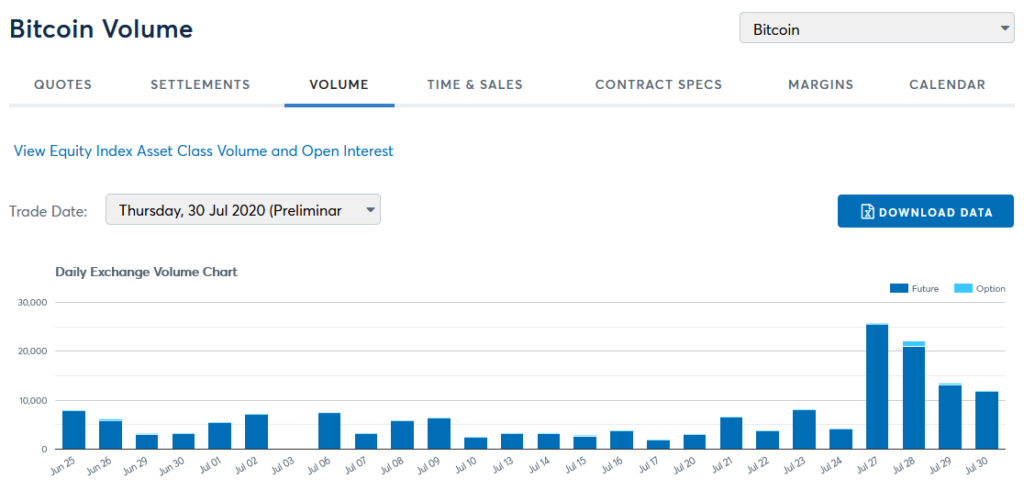
In late 2017 CME launched trading of Bitcoin futures contract. Currently in 2024 Bitcoin (BTC) and Ethereum (ETH) are the only two cryptocurrency available for trade on CME. According to CME group the daily traded volume of Bitcoin on this platform is more than 15000 BTC. That’s over a Billion USD at current price.
Alright! Now what is a price gap and what constitutes a gap on a chart?
What is a price gap?
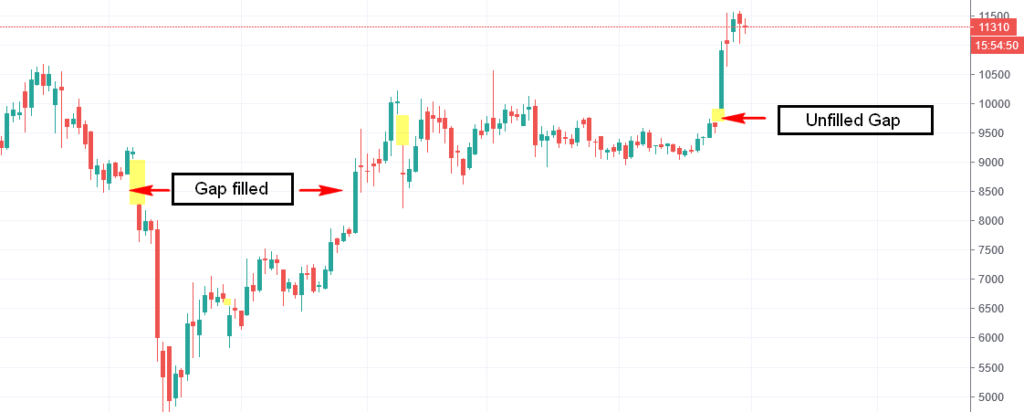
To put it plainly; A gap is simply an area on a chart that has no trades. It is basically an empty space between the close and open price of an asset. In this Bitcoin charts you can see there is an unfilled gap from 9666 to 9920.
A gap is an unfilled interval on a chart. It usually occurs when price sharply moves up or down with very little to no trading occurred in between. Sometimes a gap may also form when the market closes and this is how the CME gaps are usually formed.
What is a CME gap?
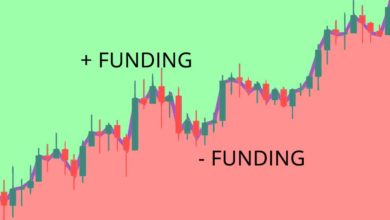
CME Bitcoin futures gap: Well, Bitcoin (BTC) is being traded 24/7 on majority of crypto exchanges, but not on CME. Bitcoin does not trade during weekends on CME and this causes gap on CME chart once the trading resumes on the platform.
The CME gap on Bitcoin typically occurs when the price of Bitcoin moves after the CME futures market is closed. For instance let’s take a look at the below scenario. Back in 2020 the rally that caused a massive CME futures gap from $9,600 to $9,900.
On Friday July 24th the daily candle of Bitcoin closed at $9620. This is when the CME futures market closed and stopped trading. Meanwhile during the weekend Bitcoin was traded on other exchanges.
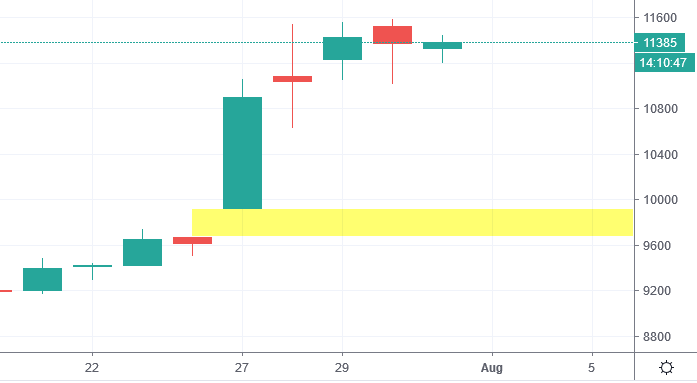
Once CME opens; the trade on CME resumes at the same price as other Bitcoin exchanges thus creating a gap on the CME chart.
On July 27 Monday the daily candle of Bitcoin opened at $9920 and closed at $10900. From there it spiked to 11k and is in an upward trend. The continuous upward price action left a gap on CME chart from $9650 to $9920.
Okay, but how do I spot these gaps on the Bitcoin chart?
How to find CME chart and spot gaps?
To spot CME gaps you need to open the CME chart.
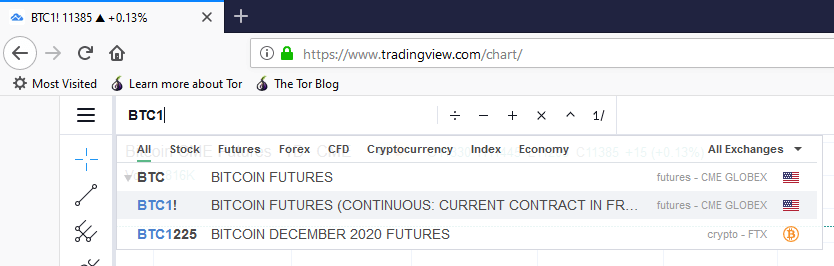
Go to TradingView and in search bar type BTC1! which will open the BTC CME futures chart.
Now gaps can be spotted on any time frames such as 1H, 4H, Daily etc. Once the chart is open, choose the time-frame, and adjust the timescale or move the chart to spot the gaps. It’s not that every weekend a new gap is formed. It only occurs when Bitcoin makes a powerful weekend move.
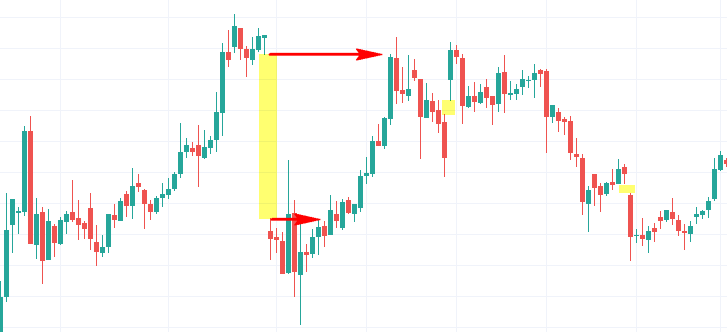
Now when someone says “A gap has been filled”. It means the price returned back to the pre-gap level (unfilled gap) and filled the price gap as you see in the image below.
Alright! Now the question is why is it necessary for CME gaps to be filled and do gaps on charts always close?
Why CME gaps fill?
Price gaps getting filled is not just a CME phenomenon and is not just a Bitcoin thing. It’s a common occurrence that can also be seen quite regularly within stock and traditional markets. In most cases the price tend to fill the gaps and due to this many technical analysts consider gaps when doing price analysis. But why do they fill?
In physics there is a famous saying: “Nature abhors a vacuum“. This idiom is used to express the idea that any unfilled, empty spaces are unnatural and goes against the laws of physics and nature. This is based on Aristotle’s observation. Nature contains no vacuums because the denser surrounding material continuum would immediately fill the rarity of an incipient void.
Could this possibly be the reason why the gaps are getting filled?
Well, there are several different theories regarding this but the fact is no one exactly knows why gaps fill.
Do gaps always close?
Do gaps always need to close? Well, no. However if we take a look back at the previous Bitcoin gaps it is evident that Bitcoin price likes to come back and fill the gap. But they don’t fill immediately. Some closes on the opening day, some closes within the next weekend, some takes months to fill and there are few that is still left open.
It is evident that any open spaces on charts seem to fill at some point of time. But remember that it is only 95% certainty and trading Bitcoin based on CME futures gaps is risky.
Trading based on Bitcoin price gaps
Although CME accounts for a portion of BTC traded volume, the price of Bitcoin does not necessarily gravitate towards CME gaps. There are so many other factors such as Volume, momentum, buy / sell pressure, technical structures, support / resistance and many more.
Traders consider gaps as an interesting marker on a chart. But they don’t necessarily trade on as they are not always a reliable indicator. They have high hit rate and so using them on your technical analysis will help you position yourself on the right side of the trade. However taking a trade solely based on this one factor is a wrong move.
Trading gaps seems like an easy strategy but the risks are high and in most cases you’ll be on the losing side. So do not risk your trade with just this one strategy. Use proper risk management, set stop losses and be sure to trade safe.
Hope this helps. From now on if someone says “Bitcoin (BTC) is going to go up or down to fill the CME gap”, you know what it means.
Apart from this there are other types of gaps which traders use in their technical analysis like for example: Liquidity gap, Breakaway gap, Common gap, Exhaustion gap and Measuring gap. This we’ll explain in another article.
Trade Bitcoin on BitMEX: Use this link and get 10% fee discount for first 6 months.
Trade on Binance Futures: Sign up using this link and get 20% discount.