
Bitcoin DCA Calculator — Dollar-Cost Averaging with Real Historical Data
Most people who invest in Bitcoin don’t buy it all at once. They invest a little every week or every month, whenever they can — $50 here, $200 there. That approach has a name: dollar-cost averaging, or DCA. And it has a remarkably consistent track record with Bitcoin specifically.
This calculator lets you test any DCA scenario against real historical Bitcoin prices going back to 2010. Enter how much you would have invested, how often, and over what period — and it shows you exactly what that position would be worth today.
What Is Bitcoin DCA?
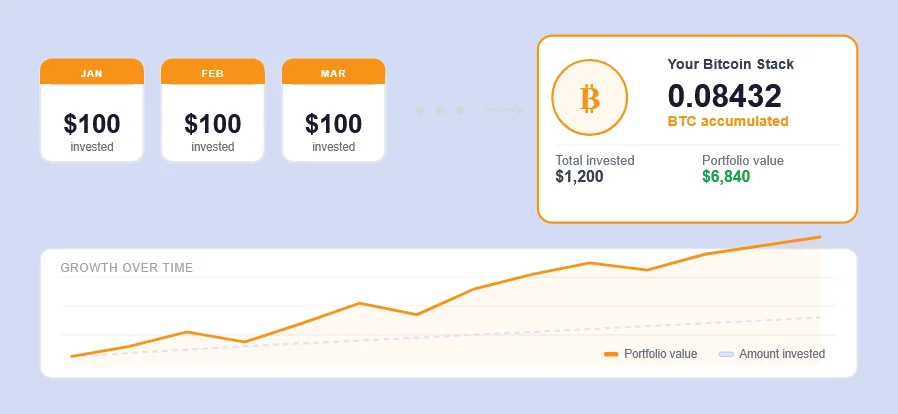
Dollar-cost averaging means investing a fixed amount at regular intervals regardless of price. Instead of trying to buy at the bottom you buy on a schedule. Sometimes you buy when Bitcoin is expensive, sometimes when it’s cheap. Over time, the purchases average out.
The key benefit is psychological as much as mathematical. A fixed schedule removes the question of when to buy. You’re not waiting for a dip that may not come. You’re not panic-selling when the price drops because you already planned to buy more at that price. The strategy suits people who believe in Bitcoin’s long-term direction but don’t want to obsess over short-term price movements.
Why Bitcoin Specifically Rewards DCA
Bitcoin’s price history is unusually volatile — it has dropped 70-80% from peak multiple times and then gone on to set new all-time highs. That pattern, whether it continues or not, is exactly what makes DCA work well in retrospect. The dips that felt catastrophic to people who bought at peaks became the cheapest purchases for people running a DCA strategy who kept buying through the downturn.
Someone who started investing $100 a month in January 2019 and held through everything — the 2020 crash, the 2021 peak, the 2022 collapse to $16,000 — would have accumulated Bitcoin at an average price far below the highs. The calculator above shows you those exact numbers for any period you choose.
How the Bitcoin DCA Calculator Works
Select your investment amount, frequency (weekly, bi-weekly or monthly), start date and end date. The calculator fetches real historical Bitcoin closing prices for every purchase date in your range, simulates each buy, and calculates:
- Your total Bitcoin accumulated
- The total amount you invested in cash
- Your effective average buy price across all purchases
- What that position is worth at the current live Bitcoin price
- Your best and worst individual purchase dates
- Plus a chart showing portfolio value versus amount invested over time
All price data is historical — not projected, not simulated with assumptions. The chart hover tooltip shows you the exact portfolio value and invested amount at any point in time.
Weekly vs Monthly — Which Works Better?
Weekly DCA produces more purchase events which technically averages your cost more finely. But the practical difference between weekly and monthly is smaller than most people expect because Bitcoin’s price tends to move in multi-month trends rather than week-to-week noise.
Monthly DCA is easier to maintain long-term because it aligns with how most people receive income. Consistency matters more than frequency — a monthly DCA strategy run for five years outperforms a weekly one that stops after six months.
Run both scenarios in the calculator above to compare the results for any specific date range. You’ll get an idea.
Lump Sum vs DCA — The Real Comparison
If Bitcoin only ever went up, lump-sum investing would always beat DCA — you’d have more exposure sooner. But Bitcoin doesn’t only go up. It has lost more than half its value in a single year multiple times. DCA reduces the risk of buying the entire position at a peak you can’t recover from quickly.
For most people investing money they can’t afford to lose in one bad year, DCA is the more rational approach. For people with high risk tolerance and a very long time horizon, lump-sum occasionally wins — but it requires holding through severe drawdowns without selling, which is harder than it sounds.
Frequently Asked Questions
1. What is a BTC DCA calculator?
A Bitcoin DCA calculator simulates what your returns would have been if you invested a fixed amount in Bitcoin at regular intervals over a chosen time period. It uses real historical price data to calculate how much BTC you would have accumulated, your average buy price, and what your position would be worth today.
2. Is DCA a good strategy for Bitcoin?
Historically, DCA has been an effective way to build a Bitcoin position without needing to time the market. Because Bitcoin’s price has been highly volatile with significant dips followed by new highs, spreading purchases over time has generally resulted in a lower average cost than single large purchases near market peaks. Past performance doesn’t guarantee future results.
3. How far back does the historical data go?
This calculator uses Bitcoin price data going back to 2010, covering all major market cycles including the 2013 rally, the 2017 bull run, the 2018-2019 bear market, the 2020-2021 cycle, and the 2022 downturn.
4. What’s the difference between weekly and monthly DCA?
Weekly DCA creates more purchase events which may result in slightly finer cost averaging. Monthly DCA is simpler to maintain. The difference in final results between the two over long periods is usually small – Remember consistency matters more than frequency.
5. Does DCA guarantee profit?
No. DCA reduces timing risk but doesn’t eliminate the possibility of losses. If Bitcoin’s price is lower at the time you sell than your average buy price, you would still be at a loss regardless of the DCA strategy used.
- Want to know your average buy price across specific trades? Use our Average Cost Calculator
- See what Bitcoin’s price would be at different market caps with our Crypto Market Cap Comparison Tool